Tools · Updated July 10, 2026
Music Analytics for Artists: Tools and Metrics Guide
Music analytics for artists should answer a practical question: which songs, audiences, cities, and platforms are creating real fans?
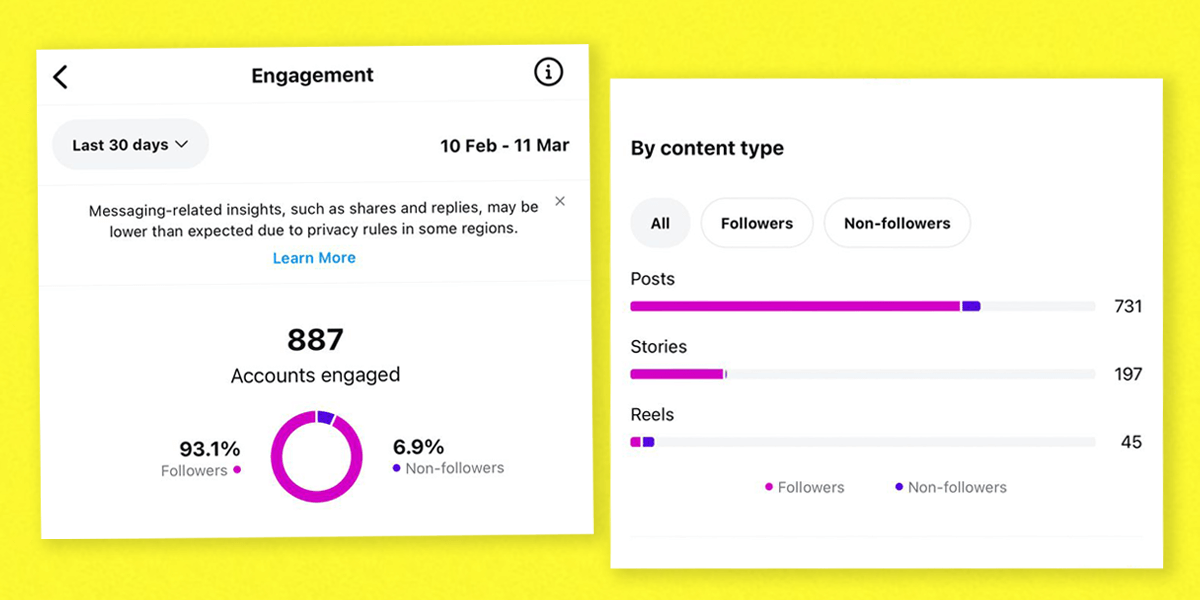
For independent artists, music analytics includes Spotify analytics for artists, Apple Music for Artists, YouTube Studio, TikTok and Instagram data, smart-link clicks, ad data, and song-level metrics like saves, streams per listener, playlist adds, and repeat listening.
The mistake is treating analytics like a scoreboard. A bigger number does not matter if it came from passive traffic that never saves, follows, or comes back.
Use music data analytics to decide what to test next: the audience, the creative, the market, the song, or the budget.
Music Analytics for Artists: Quick Answer
Start with free music analytics tools: Spotify for Artists, Apple Music for Artists, YouTube Studio, TikTok and Instagram analytics, your smart-link dashboard, and your ad platform. Track saves, followers, streams per listener, source of streams, playlist adds, top cities, content-to-stream clicks, and post-campaign baseline.
If those metrics show real listener behavior, keep testing. If they only show reach, views, or cheap clicks, fix the audience or the creative before you spend more.
What Are Music Analytics?
Music analytics are the numbers that show how people discover, listen to, save, share, and return to your music across Spotify, Apple Music, YouTube, TikTok, Instagram, smart links, websites, email, and paid ads.
The useful part is not the dashboard itself. The useful part is the decision it helps you make.
If a city is over-indexing, you can test ads there, pitch local press, or plan a show. If one clip drives clicks but no saves, the content may be good but the audience fit may be wrong. If a song has a high save rate and repeat listeners, it probably deserves more budget.
Music Analytics for Artists: What You Need
Most independent artists do not need a complicated music analytics dashboard at first. They need a simple weekly view of who listened, where those listeners came from, what they did next, and whether the campaign created real fan behavior.
- Spotify analytics: streams, listeners, saves, followers, source of streams, playlist adds, and audience geography.
- Smart-link analytics: click source, platform choice, country, device, and retargeting audiences.
- Social analytics: watch time, shares, comments, profile visits, and link clicks.
- Ad analytics: audience, creative, cost, click quality, and downstream listener behavior.
If those four views do not agree, slow down before scaling spend. A video can get attention without creating listeners. A playlist can create streams without creating fans. A smaller audience can be more valuable if the save rate and repeat listening are stronger.
Music Data Analytics vs Vanity Reporting
Music data analytics is useful when it changes the next campaign decision. Vanity reporting is what happens when you collect screenshots and never decide what to do with them.
A useful report answers plain questions: which audience saved the song, which city over-indexed, which creative drove qualified clicks, which playlist source looks suspicious, and whether new listeners came back after the campaign ended.
If the report cannot help you pick the next song angle, market, ad set, or release move, it is decoration. Keep the dashboard smaller and make the decisions sharper.
Song Analytics vs Artist Analytics
Song analytics tell you how one track is behaving. Artist analytics tell you whether the whole project is getting healthier.
For a song, watch save rate, streams per listener, playlist adds, source of streams, completion behavior on video clips, comments, shares, and whether the same hook or lyric keeps pulling people in.
For the artist, watch follower growth, returning listeners, top cities, fan capture, email or SMS growth, ticket interest, merch clicks, and whether new releases start from a higher baseline than the last one.
A single song can spike without improving the artist project. Good music analytics help you spot the difference.
Music Performance Metrics Artists Should Track
Streams are only the surface. They tell you that something happened. They do not always tell you whether it mattered.
- Save rate: the clearest early sign that listeners want the song again.
- Follower growth: proof that people want to hear the next release. If this is weak, use the Spotify follower growth guide before scaling the campaign.
- Streams per listener: whether people replay the track or disappear after one listen.
- Source of streams: whether traffic comes from algorithmic playlists, listener libraries, your profile, ads, editorial, or questionable playlists.
- Playlist adds: especially personal playlist adds, because those listeners are choosing to keep the song in their world.
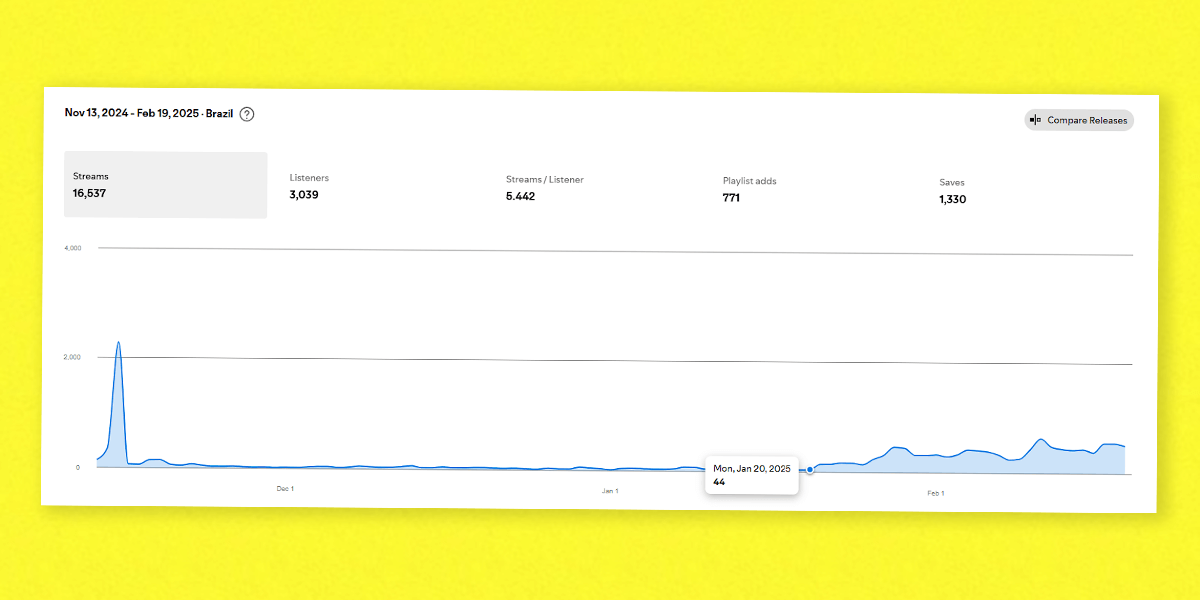
- Geography: cities and countries where the music is getting a real response.
- Content-to-stream conversion: which TikToks, Reels, Shorts, or ads move people to listen.
- Post-campaign baseline: what remains after a playlist, ad campaign, or release-week push ends.
That last one matters a lot. A campaign that spikes streams from 200 to 2,000 and then drops back to 200 taught you very little. A campaign that settles at 450 after the spend ends created something you can build on.
Vanity Metrics vs Fan Signals
The music industry loves numbers that are easy to screenshot.
Monthly listeners. Views. Follower counts. Playlist placements. Chart positions. They can matter, but they can also lie. If a chart result is part of the campaign goal, use the Billboard charting guide to separate eligible activity from a vanity spike.
A song can get 50,000 passive playlist streams and create almost no fans. Another song can get 3,000 streams from the right audience and produce saves, comments, follows, DMs, and repeat listeners. The smaller number may be more valuable.
When you read your analytics, separate reach from resonance:
- Reach: impressions, views, streams, monthly listeners, playlist reach.
- Resonance: saves, repeats, follows, comments, shares, email signups, ticket clicks, merch clicks.
Reach tells you how many people touched the song. Resonance tells you whether it touched them back.
Data Sources for Music Analytics
Spotify for Artists
Spotify for Artists is the first place most artists should look. Watch streams, listeners, saves, followers, source of streams, playlists, audience location, age, gender, and how each song performs over time.
The most important Spotify view is source of streams. Listener library and algorithmic traffic mean something very different from a random third-party playlist spike.
Spotify Analytics for Artists
Spotify analytics for artists are most useful when you read them as listener-quality data instead of stream-count data. Pay attention to source of streams, saves, listeners, followers, playlist adds, audience geography, and how each song behaves after the campaign spike fades.
The question is not only "did streams go up?" It is: did the right listeners save, follow, replay, add the song to playlists, and come back through listener library or algorithmic sources?
Apple Music for Artists
Apple Music for Artists helps you understand plays, Shazams, purchases, playlist performance, and listener locations. Shazam data is especially useful because it can reveal moments where people heard the song in the real world and cared enough to identify it.
YouTube Studio
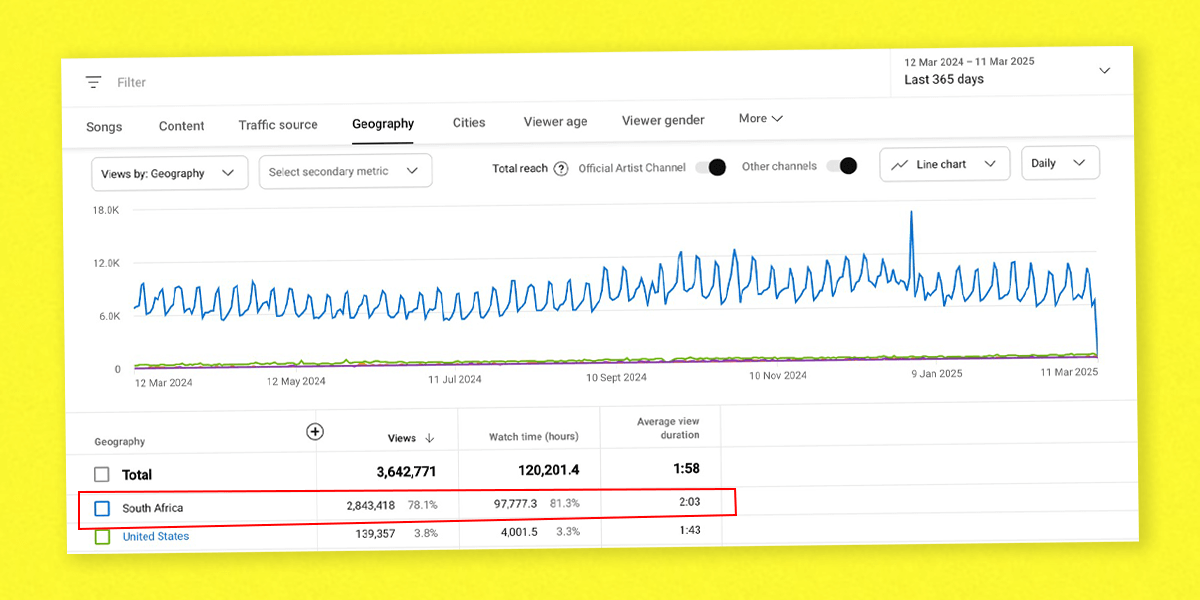
YouTube data is where you learn whether your video is holding attention. Watch click-through rate, average view duration, retention curves, traffic sources, and which videos send people deeper into your channel.
For music videos, retention often tells the truth. If everyone leaves before the hook, you may have a visual or intro problem, not a marketing problem.
TikTok, Instagram, and Shorts
Social analytics show which creative angles make people stop. Track watch time, shares, saves, comments, profile visits, link clicks, and which clips lead to Spotify movement.
A clip going viral is nice. A clip that creates listeners is better.
Smart Links and Website Analytics
Smart links for music show what happens between interest and listening. Tools like Feature.fm, Linkfire, ToneDen, Hypeddit, and similar platforms can show clicks by platform, country, device, and sometimes downstream actions like follows or pre-saves.
Use smart links to compare intent. If 1,000 people click but only a tiny percentage choose Spotify, Apple Music, YouTube, or email signup, the landing page or audience may be misaligned.
Ad Platforms
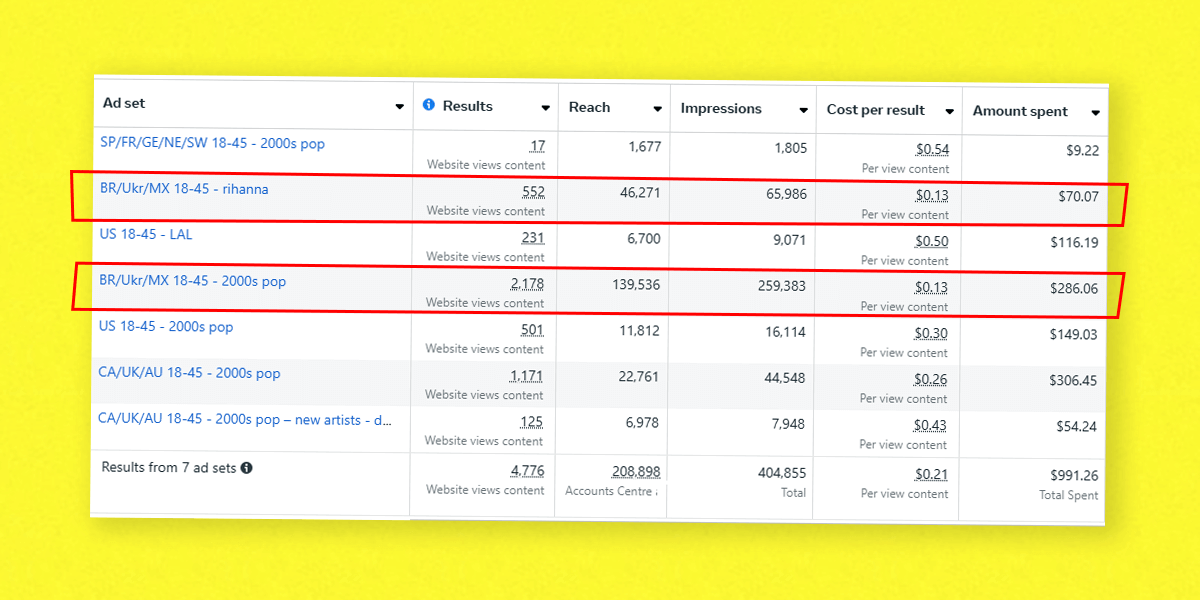
Meta, TikTok, YouTube, and Google Ads show which audiences and creatives produce action. Do not stop at cost per click. A cheap click that creates no saves is not cheap. A more expensive click from the right listener can be the better buy.
How to Read Spotify Source of Streams
Source of streams is one of the most underrated reports in Spotify for Artists because it tells you whether growth is active, passive, or algorithmic.
Read it this way:
- Your profile and catalog: people are actively looking around your world.
- Listener library and playlists: people saved or personally kept the song.
- Algorithmic playlists: Spotify is starting to recommend you based on listener behavior.
- Editorial playlists: Spotify's team placed the song, which can be powerful but temporary.
- Other listener playlists: can be useful, but quality varies wildly.
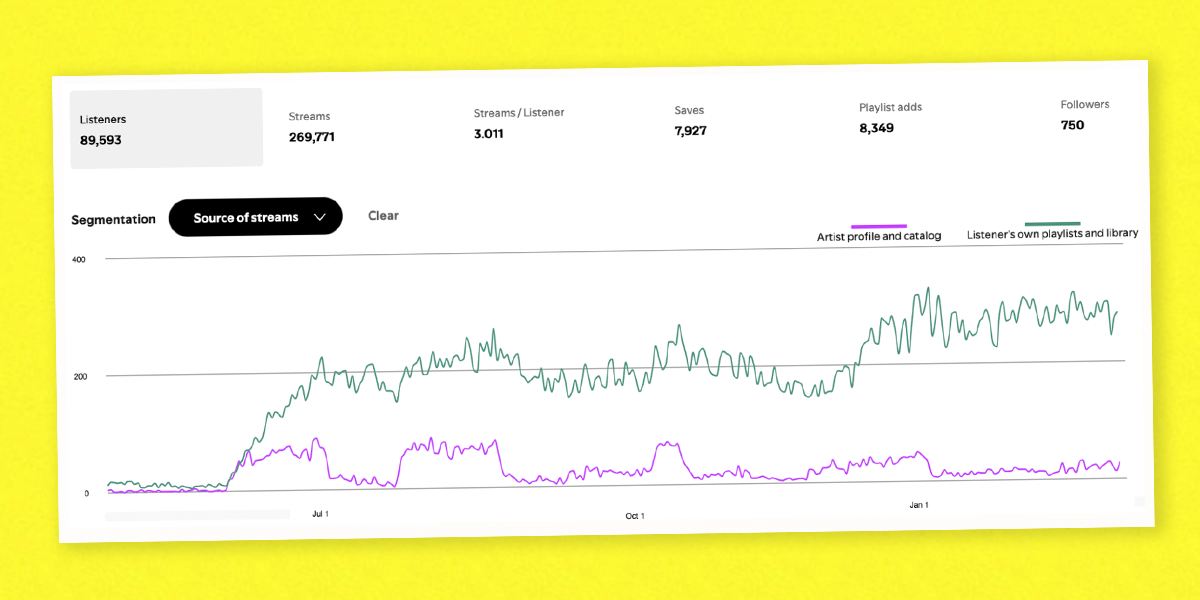
The healthiest campaigns show a mix: paid or social traffic creates initial listeners, saves and follows build library activity, and strong engagement eventually feeds algorithmic discovery.
Free Music Analytics Tools
Start with the free music analytics tools before paying for a bigger platform:
- Spotify for Artists: the main free dashboard for Spotify streams, listeners, followers, source of streams, playlist data, and audience geography.
- Apple Music for Artists: Apple Music plays, Shazams, purchases where available, playlist data, and listener locations.
- YouTube Studio: views, retention, traffic sources, search terms, subscribers, and video-to-channel behavior.
- TikTok and Instagram analytics: watch time, completion, shares, saves, comments, profile visits, and link clicks.
- Smart-link reports: platform choice and campaign-click data from your release links.
Paid tools become useful when you need broader playlist tracking, cross-platform reporting, competitive context, roster monitoring, or alerts. Do not buy a dashboard before you know what decision it is supposed to improve.
Best Music Analytics Tools for Artists
You do not need every tool. You need the tool that matches the decision you are trying to make.
Spotify for Artists
Best free starting point for Spotify listener behavior, playlist sources, follower growth, and release performance. Use it every week during a release cycle.
Apple Music for Artists
Best for Apple Music listener data, Shazam activity, and understanding markets where Apple over-indexes for your audience.
Chartmetric
Chartmetric is useful when you need a bigger industry view: playlists, radio, social growth, audience trends, and competitive context across many platforms.
Soundcharts
Soundcharts is built for tracking artist activity across streaming, radio, playlists, charts, and social data. It is stronger for teams that need broader market monitoring.
Songstats
Songstats is helpful for alerts and day-to-day momentum tracking across playlists, charts, and streaming milestones.
Feature.fm, Linkfire, ToneDen, and Hypeddit
These tools show where people click, which platforms they choose, and how release links, pre-saves, and retargeting audiences are performing.
Music Analytics Dashboard: Simple Weekly View
You can build a useful music analytics dashboard in a spreadsheet. Track it once per week so you can see whether the campaign is compounding or producing noise.
| Metric | Why it matters | Where to find it |
|---|---|---|
| Saves and save rate | Shows whether listeners want the song again | Spotify for Artists |
| Followers | Shows whether the release is building future reach | Spotify for Artists and social dashboards |
| Source of streams | Separates library, algorithmic, playlist, profile, and campaign traffic | Spotify for Artists |
| Platform clicks | Shows which services listeners choose after clicking | Smart-link tool |
| Watch time and link clicks | Shows which content creates real curiosity | TikTok, Instagram, YouTube |
| Cost per qualified listener | Connects ad spend to saves, follows, and repeat listening | Ad platform plus Spotify and smart-link data |
| Top cities and countries | Shows where to test content, ads, press, and shows | Spotify, Apple, YouTube, and ad platforms |
The dashboard does not need to be pretty. It needs to make the next decision obvious: keep the audience, change the creative, shift the market, raise the budget, or stop the test.
How to Turn Music Analytics Into a Release Plan
Data does not help unless it changes what you do next.
Use this weekly review:
- Pick one goal: followers, saves, email signups, ticket interest, or streams from a target market.
- Find the strongest song or clip: do not spread budget evenly if one asset is clearly pulling harder.
- Check listener quality: saves, followers, repeat listens, and playlist adds matter more than raw reach.
- Find the best market: identify the cities or countries responding above baseline.
- Decide the next test: new ad creative, new audience, new content angle, playlist pitch, email push, or local show idea.
- Write down the learning: if you do not document it, every release starts from zero again.
The goal is to make the next release less random than the last one.
Campaign Example: Finding a Market You Missed
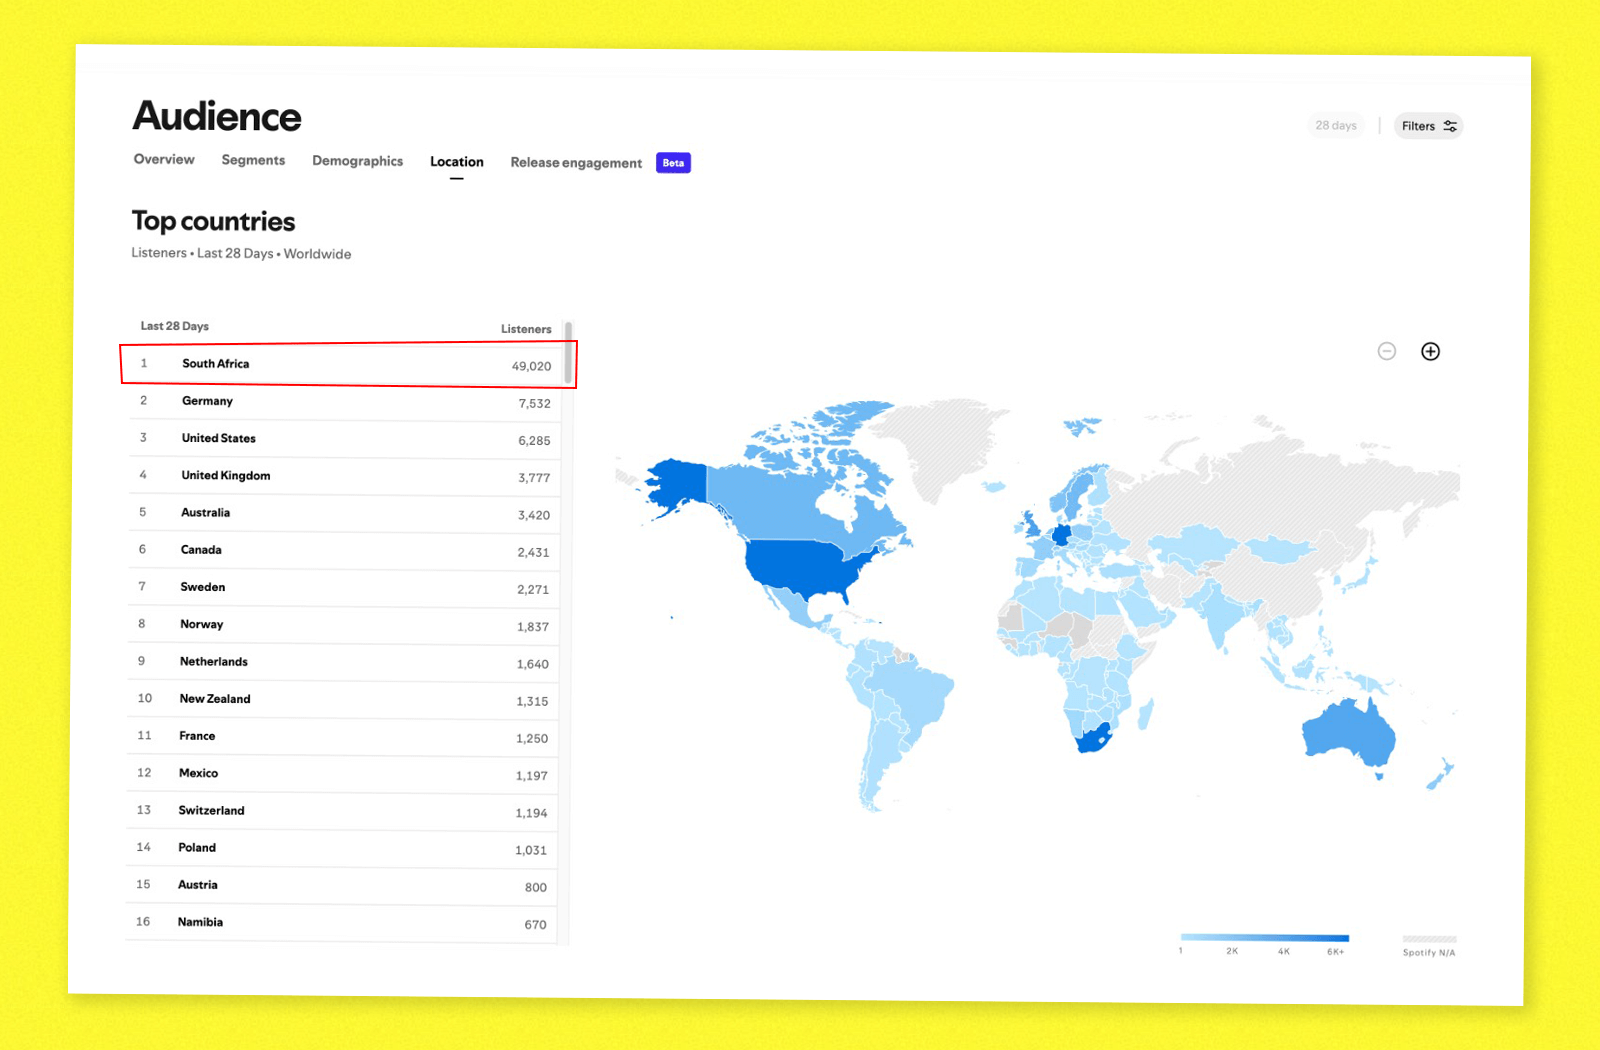
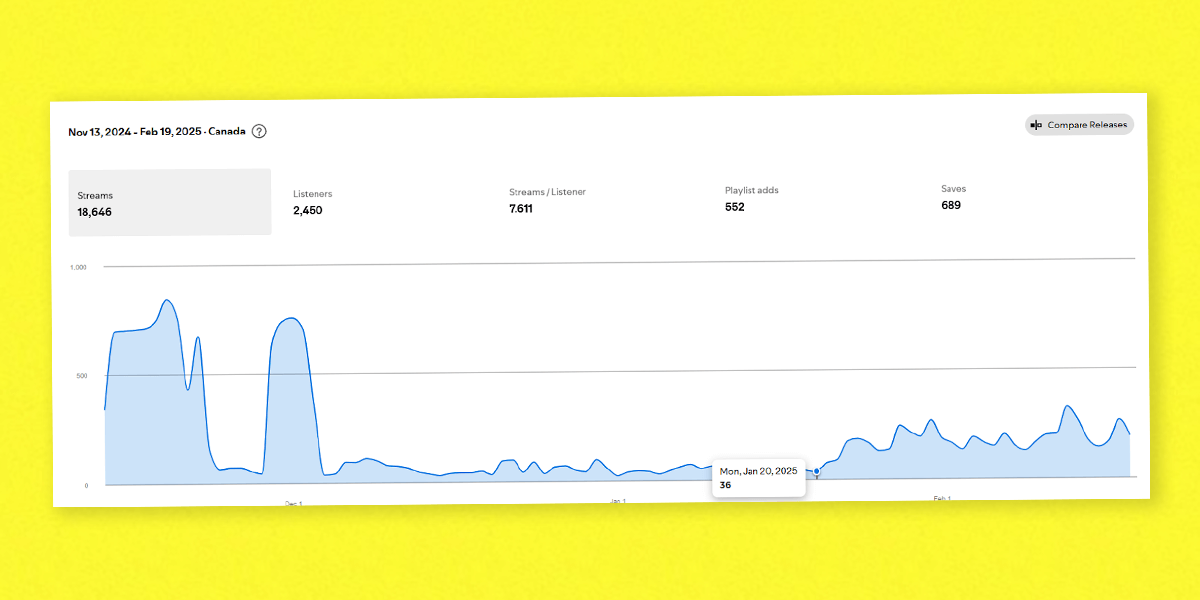
During one campaign, we initially overlooked Canada. Once we adjusted targeting and creative toward that audience, daily streams lifted sharply and the campaign started producing cleaner listener behavior.
That is what music analytics are for. Not to stare at charts. To notice the market, message, or song that is quietly telling you where to go next.
Common Music Analytics Mistakes
- Judging everything too early: some songs need repeated exposure before the data becomes useful.
- Optimizing for cheap clicks: low-cost traffic can poison your Spotify signals if the listeners do not care.
- Ignoring source quality: playlist streams, ad streams, algorithmic streams, and library streams are not the same.
- Not comparing baseline: a spike only matters if something stays higher afterward.
- Copying another artist's audience: similar artists are clues, not a full strategy.
- Using data to avoid creativity: analytics should sharpen your instincts, not replace them.
The Best Music Analytics Stack
If you are an independent artist, start simple:
- Spotify for Artists: listener behavior and source of streams.
- Apple Music for Artists: Apple and Shazam signals.
- YouTube Studio: video retention and search discovery.
- TikTok and Instagram analytics: content testing and fan response.
- A smart-link tool: click behavior and retargeting audiences.
- Ad manager data: creative and audience tests.
Only add paid tools like Chartmetric, Soundcharts, or Songstats when you have a specific reason: playlist tracking, market monitoring, roster reporting, or competitive research.
What To Do Next
Open Spotify for Artists and pick one song. Do not look at the biggest number first. Look at save rate, source of streams, listener countries, follower movement, and whether streams per listener are improving.
Then ask: what would I do differently if I believed this data?
Maybe you test a new country. Maybe you stop spending on the wrong audience. Maybe you turn the best-performing lyric into three more videos. Maybe you build a proper release plan instead of posting the cover art and hoping.
Analytics are not the strategy. They are the feedback loop.
If you want help turning listener data into a campaign that compounds, work with simpl. We build Spotify ad campaigns, content tests, and release systems around the signals that show real fan behavior.
Keep building the system with Spotify promotion services, smart links for music, and waterfall release strategy.
Keep building the strategy
-
Spotify promotion services
Use analytics to judge listener quality, not just stream volume.
-
Smart links for music
Track clicks, platforms, and fan journeys before and after release day.
-
Spotify ads for artists
Turn audience data into campaigns that test and scale real listener behavior.
About the author

Anthony Pacheco
Anthony Pacheco is the founder of simpl., a former Sony Music analyst, and a Billboard-charting musician who has helped run 750+ artist marketing campaigns. He writes about real listener behavior, release systems, Spotify ads, and how artists can grow without fake playlist traffic.